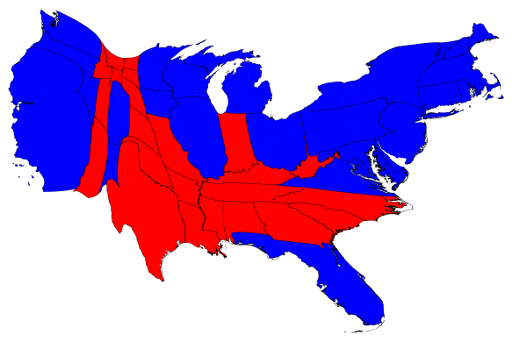
The presidential election, however, is not actually decided on the basis of the number of people who vote for each candidate but on the basis of the electoral college. Under the US electoral system, each state in the union contributes a certain number of electors to the electoral college, who vote according to the majority in their state. (Exceptions are the states of Maine and Nebraska, which use a different formula that allows them to split their electoral votes between candidates.) The candidate receiving a majority of the votes in the electoral college wins the election. The electors are apportioned among the states roughly according to population, as measured by the census, but with a small but deliberate bias in favor of less populous states.
Read more here
http://www-personal.umich.edu/~mejn/election/2012/
No comments:
Post a Comment